Revisiting “The Babel Tower Of EPC Ratings”: Updated Thresholds Across Europe
In 2020, European DataWarehouse (EDW) published “The Babel Tower of Energy Performance and Certificate Ratings in Europe”. This article contained a table comparing the Energy Performance Certificate (EPC) rating thresholds across various countries and discussed EPC databases in Europe.
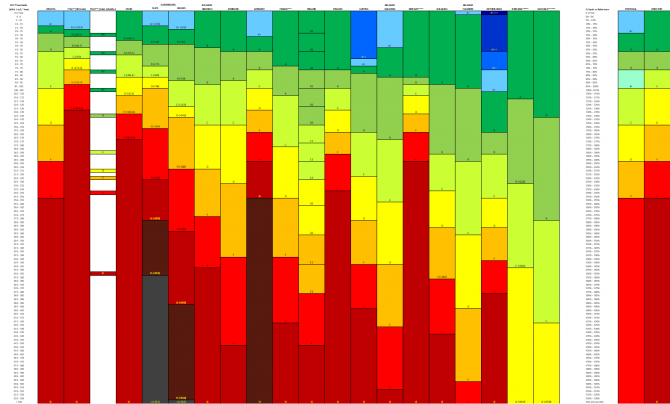
In particular, the article highlighted those thresholds can vary substantially from one country to the next or even within a country. The table attracted a lot of attention and was reproduced in several, very visible, third-party publications. Exhibit 1 below is a partial update of this table.
Exhibit 1: A Comparison of Various EPC Thresholds Across European Countries

Source: European DataWarehouse; see original information source in the Excel attachment below
Click here to download EXCEL.
Some values have changed since 2020, mostly due to changes in methodology. For instance, French EPCs now use a double scale, with both energy efficiency and CO2 emissions constraints for a given rating. The revised Energy Performance of Buildings Directive foresees in its Article 19 some steps to harmonise European calculation methods and thresholds.
In general, EDW analysis shows that most EPC ratings refer to the primary energy usage per square meter and per year, although some are defined differently. For instance:
-
In Portugal, a percentage of a benchmark is shown.
-
In Luxembourg, the type of dwelling is taken into consideration (flat vs house).
-
In Belgium, there is one scale for Flanders, one for Brussels, and one for Wallonia.
-
In Italy, many criteria are taken into consideration for the EPC rating (including the geographic zone).
The content of the table is therefore a simplification. In the case of Italy, the values shown in Exhibit 1 represent those for a flat in Rome; given that the Italian EPC methodology is in fact relatively complex, the actually observed mean values are shown using the Lombardy EPC database (maintained by Aria S.p.A.).
CHALLENGES IN TRACING EPC INFORMATION: VARIED SOURCES AND RATING SCALES ACROSS EUROPE
In an effort to allow readers to trace the Babel Tower information on a country’s EPCs, a recent official source for each country was explored. Finding the currently applicable rating scales or method in every country proved to be challenging. For some countries, the source is either an agency such as ADEME in France, for others, it is a European Commission document containing a similar although simplified comparative table.
RELEVANCE OF EPCS FOR RESIDENTIAL MORTGAGE-BACKED SECURITIES
The ESMA Securitisation Regulation (EU) 2017/2402, include the EPC for properties as field RREC10. While the availability of EPC information is growing over time in line with the emissions reduction in the European Union, the allowed no-data values are usually inserted by reporting entities due to the data availability challenges.
According to EDW estimations, France and the Netherlands are the two countries for which EPC information is the most often populated.
To some extent, data field RREC10 reflects the transition risk a mortgage is subject to. As countries endeavour to make the properties more energy efficient, owners of the worst-rated properties may be unable to let them if their ratings are too low and be forced to renovate.
For example, according to ADEME, the French Environment and Energy Management Agency, the following applies:
-
Since Jan. 2023: letting ban for G rated properties with energy demand exceeding 450kWh/m2/year
-
From Jan. 2025: ban on the letting of G rated properties
-
From Jan. 2028: ban on the letting of F rated properties
-
From Jan. 2034: ban on the letting of E rated properties
THE RELATIONSHIP BETWEEN EPC RATINGS AND MORTGAGE PERFORMANCE
The topic of EPCs is regularly discussed at EDW’s quarterly research webinars. The Q1 2022 Research Webinar, for instance, provided statistics on EPC data availability, as well as the cumulative delinquency charts shown in Exhibit 2.
In Exhibit 2a and 2b, cumulative delinquencies (loans that have gone in arrears or default at least once) are depicted as % of original balance, grouped by EPC category. It appears that performance is somewhat worse for the worst EPC categories.
Exhibit 2a: Mortgage Cumulative Delinquencies (Netherlands)

Source: European DataWarehouse; Q1 2024 EDW Research Webinar
Exhibit 2b: Mortgage Cumulative Delinquencies (France)

Source: European DataWarehouse; Q1 2024 EDW Research Webinar
At least two publications (see below) also found some correlation between energy performance and credit performance, although it is not completely clear why there is such a relation. A possible explanation is that the wealthier borrowers tend to buy the most (typically new and expensive) energy efficient properties and are also probably less likely to default.
See “Residential EPCs versus Credit Relevance“ (Morningstar DBRS, September 2023) and Billio M., M. Costola, L. Pelizzon and M. Riedel (2022), “Buildings’ Energy Efficiency and the Probability of Mortgage Default: The Dutch Case”, Journal of Real Estate Finance and Economics, 65/3, 419-450 for further information.
This topic was covered in further detail on EDW’s Q2 Research Update Webinar on 24 June 2024. The slides and recording are available for download on our website.
EDW’S COMMITMENT TO THE IMPROVEMENT OF ESG DATA AVAILABILITY AND QUALITY
EDW, as part of the ENGAGE for ESG initiative that it is leading, is currently developing dedicated templates (ENGAGE Templates) and IT infrastructure (ENGAGE Portal) to collect and analyse sustainability data relating to residential mortgages and home renovation loans with the aim of assessing the alignment of the relevant loans with the EU Taxonomy. The ENGAGE Templates are available upon request here.
To learn more about the ENGAGE templates access the slides and recordings from the ENGAGE Templates Webinar Series.
Meanwhile, we invite you to forward your research-related questions to enquiries@eurodw.eu.
